
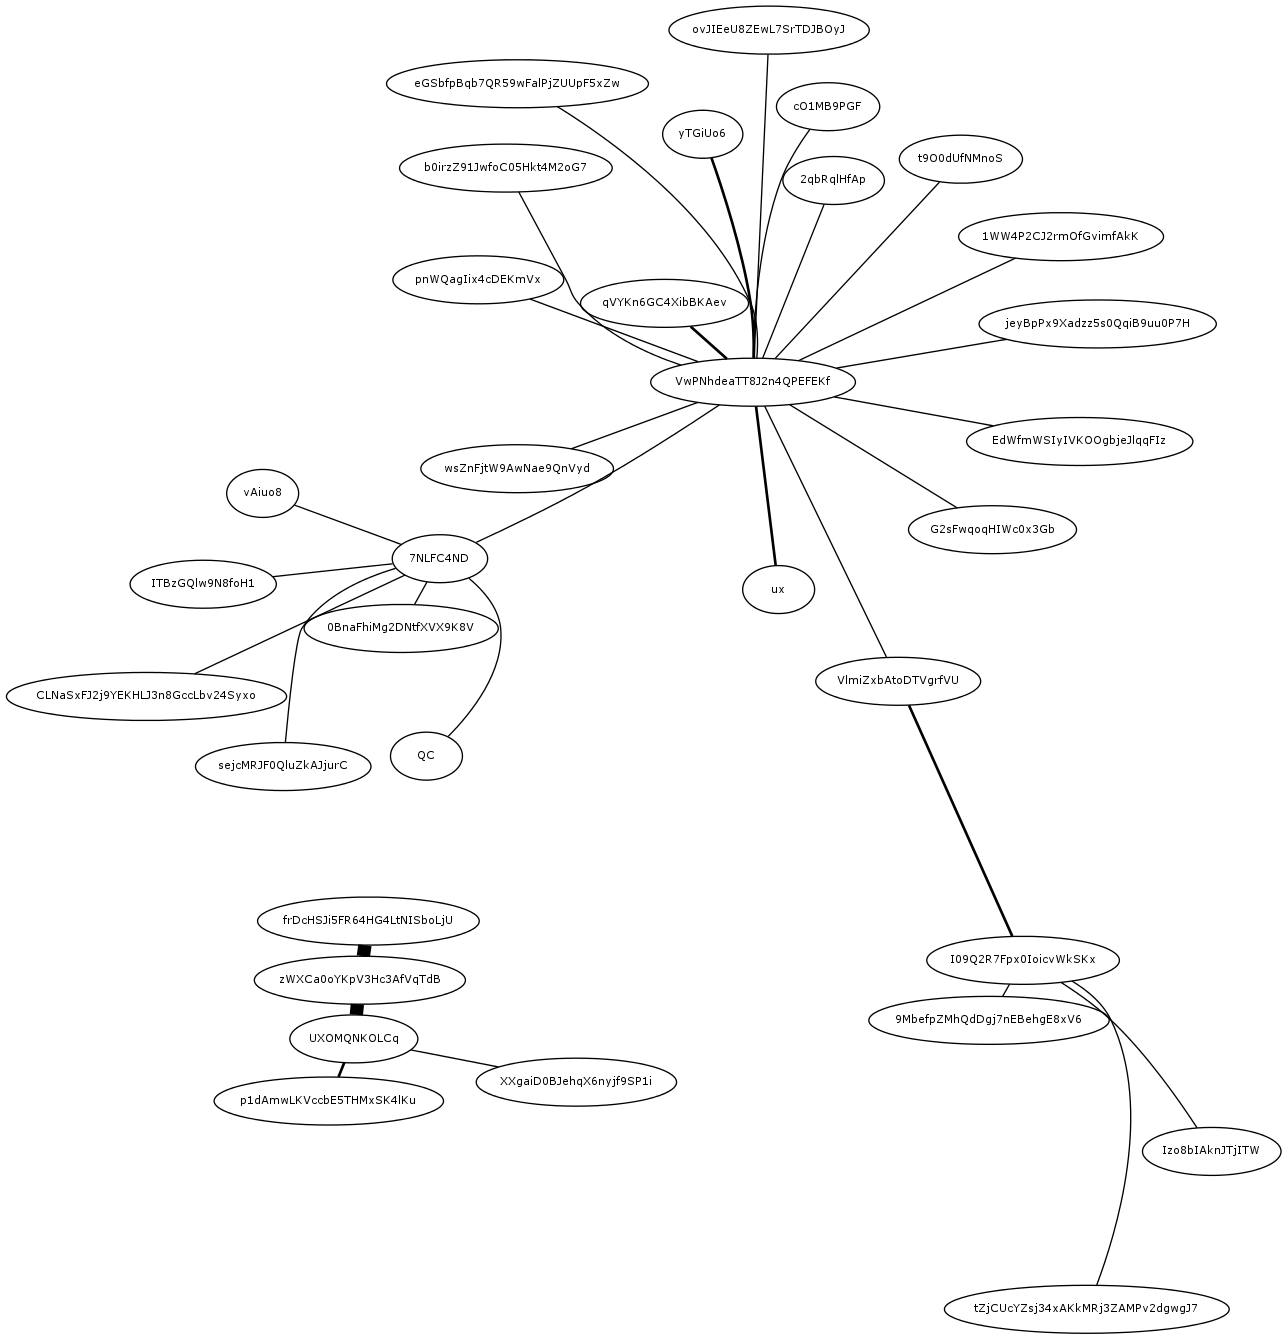
A graph showing communication partners.
A graph showing communication partners. It was generated from transaction logs and is shown anonymised. You can clearly see which person has ties (i.e. communicates) to other persons. The thickness of the lines indicates the volume of the messages. Thicker lines mean more messages.